Introduction
When it comes to marketing analytics, as with everything in life, the less complicated the better. Simplicity is the key. My intention is, therefore, to outline what I consider essential in sales analytics, focusing on the minimal Key Performance Indicators (KPIs) necessary to measure results, optimize campaigns, and bring predictability to operations. By the end of this article, you should be able to: (1) evaluate the efficiency of different lead acquisition channels; (2) accurately forecast the revenue generated for every additional dollar invested in sales operations; and (3) determine whether your operations are financially viable (i.e., generating more revenue than expenses).
To achieve these goals, our approach to sales analytics will be divided into three levels of operation:
- Campaign Level: The objective here is to do AB Testing and continuously optimize campaigns. We will focus on both Outbound - cold e-mail - metrics (email open rates, reply rates, and booking rates), as well as Click-through Rate (CTR) and Cost-per-Click (CPC) for inbound, paid media campaigns.
- Lead Acquisition Channel Level: This level is aimed at comparing the performance of various channels to identify which ones are most effective for your business. This enables you to prioritize investments and optimize Return on Investment (ROI).
- Overall Revenue Operations (RevOps) Level: At this stage, the goal is to assess the overall viability of operations and forecast future revenues and cash-flow based on investments across all lead acquisition channels.
As a "Go-to-Market (GTM) Engineering" agency, one of our implicit objectives is to help you evaluate the efficiency of your sales operations using GTM strategies compared to traditional approaches like SDRs and cold calling. Our assumption is that GTM strategies are significantly more cost-effective.
In my AI Revolution article, I reference a LinkedIn post by a fellow GTM Engineer - Aamir Bajwa, who compared the cost of lead generation using one GTM Engineer versus a team of five SDRs. His analysis showed that lead acquisition with a single GTM Engineer was approximately $20,000 less expensive than using a team of five SDRs. With this guide and the accompanying Excel spreadsheet I will provide, you should be able to calculate these costs for your own Revenue Operations.
Before proceeding, it is essential to clarify the distinction between a lead acquisition channel and a campaign. For example, cold email is a channel comprising various cold email campaigns. Each email sequence, targeting different prospect lists, represents a separate campaign. Similarly, LinkedIn Ads is a channel that includes multiple campaigns with varying creatives, copy, and target audiences.
Sales Analytics on a Campaign Level
I recently came across a blog post discussing ideas for A/B testing cold emails. The suggestions included aspects such as “subject line length,” “using lowercase in subject lines,” “intro or no intro in the first line,” and “numbered lists versus bullet points". For gods’ sake, run away from this nonsense.
You should focus your A/B testing on factors that can genuinely impact your campaigns. These include:
- Target Audience – This applies both to the company (industry/ICP) and the persona (job title).
- The Value Offer – The sales asset that you will offer in your first e-mail, providing value to the prospect before asking for a meeting (please read this article to have a better understanding about the “Value-Offer” strategy)
- Copy Angle – This refers to the core message of your email, which acts as the hook to capture the lead’s interest. It should succinctly convey your problem-solution fit before introducing case studies or social proof.
Now you may be asking yourself, what about the CTA? Well, If you’ve read my article on value-offer strategies, you’ll know that the CTA remains consistent: a simple request for permission to share your sales asset. For example, “Can I send you a video?”, and the desired “action” expected from our lead, with this CTA, would be: “Yes, you can” (hopefully).
Here’s how to structure your testing process: for each new campaign, adjust only one factor at a time. For instance, use the same email copy and value-offer but target a different persona (e.g., job title). After sending a significant number of emails (at least 200), compare metrics such as open rate, reply rate, and booking rate. In the next iteration, keep the persona constant but test a different factor - such as targeting a new ICP industry. And then you keep optimizing it indefinitely.
Obs: When prospecting (and AB testing) diferrent industries - at a company level - you are targeting vertically (e.g., B2B SaaS companies, manufacturing firms, marketing agencies). When focusing on job titles across various industries, you are targeting horizontally (e.g., accountants, VPs of sales, CROs, DevOps teams).
Booking Rate Definition.
Booking Rate = Number of meetings booked ÷ Number of prospects contacted
This metric is often overlooked but is crucial. If one campaign shows higher open and reply rates but lower booking rates, investigate the reasons behind this discrepancy.
For paid media campaigns (e.g., LinkedIn Ads or Google Ads), the principle is similar. However, instead of personas, you’ll focus on target audiences. Your core messaging may vary depending on the ad format—whether it includes creative design (video or imagery) or is purely text-based. The primary metrics for these campaigns are Click-through Rate (CTR) and Cost-per-Click (CPC).
By focusing on these high-impact areas and refining your approach iteratively, you can significantly improve your campaign performance without wasting time on trivial details.
Sales Analytics on the Acquisition Channel Level
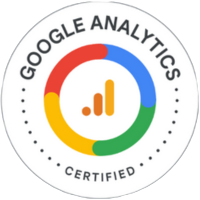
Here, we will evaluate the efficiency of lead acquisition channels using a single key performance indicator (KPI): Cost per Acquisition (CPA). CPA is a marketing metric that calculates the total cost incurred to acquire one paying customer, assessed at either a campaign or channel level. In this case, we will focus on channel-level analysis.
To calculate CPA, you need the total marketing and sales costs associated with a specific channel and the total number of acquisitions (conversions) resulting from those efforts. The formula is as follows:
CPA = Total Marketing Costs / Total Number of Acquisitions
The total marketing costs may include expenses such as advertising spend, CPC for paid media, agency fees, content creation costs, and other related expenditures. Sales costs should include expenses associated with technology tools and sales personnel. For personnel working across multiple channels, allocate costs proportionally based on the volume of leads processed or sales closed within each channel.
It is worth noting that a channel may have a higher Cost per Lead but a lower Cost per Acquisition, which is ultimately the more critical metric. For example, cold calls are highly personalized and may not generate leads in large quantities, but they often result in higher meeting scheduling and conversion rates.
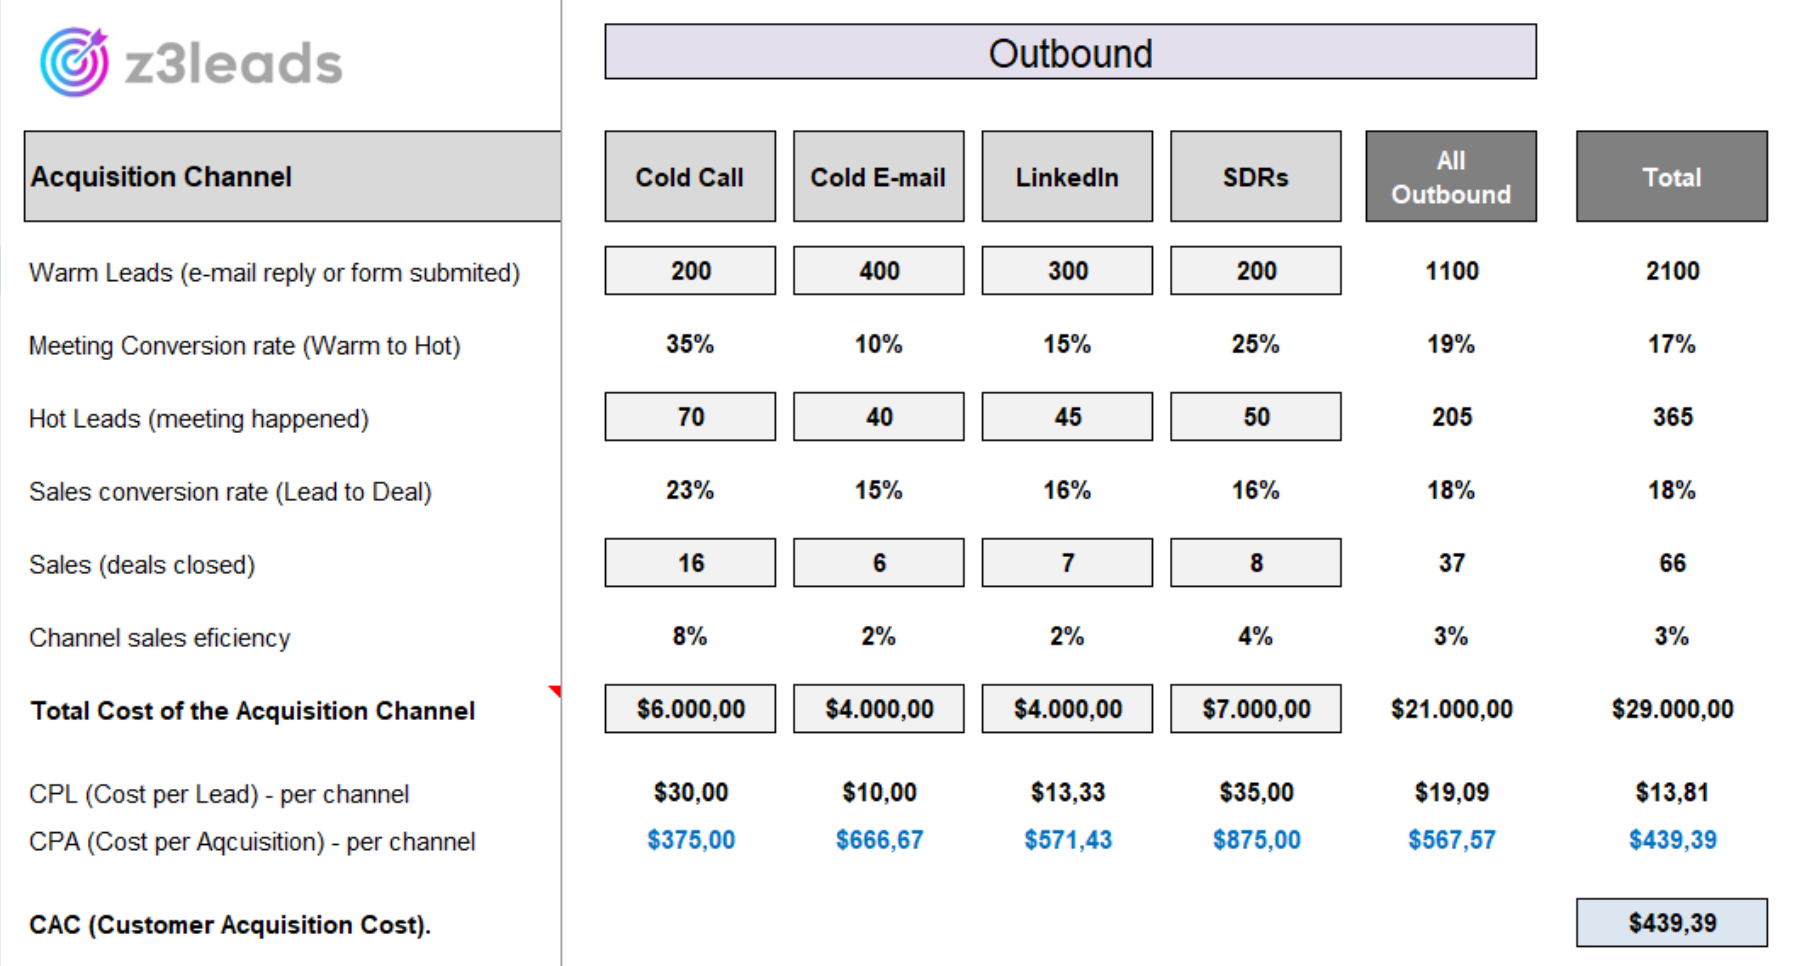
Inbound leads, on the other hand, typically originate from long-term investments in SEO and content marketing. While it can be challenging to attribute costs directly to these efforts, they yield lasting results and, in the long run, often represent the most cost-effective lead acquisition channel. These leads, often referred to as “Hand Raisers,” are individuals who proactively request to engage with your sales team. Their CPA will be minimal, since they do not require investments in paid media or outbound prospecting.
If outbound channels demonstrate a lower CPA than inbound channels, increasing outreach efforts—such as launching additional cold email campaigns—might seem like a viable strategy. However, this approach could lead to targeting broader audiences outside of your ideal customer profile (ICP), potentially reducing reply rates and increasing the Cost per Lead. Similarly, if paid media offers a better return on investment (ROI), expanding the budget for these campaigns can prove effective, provided there are untapped markets within your total addressable market (TAM).
By accurately calculating the CPA across all channels, you can make data-driven decisions to optimize your marketing and sales strategies. For instance, you may find that leveraging your Go-to-Market Engineer results in a significantly lower CPA compared to relying solely on a business development team. This is actually the thesis I am trying to prove. 😁
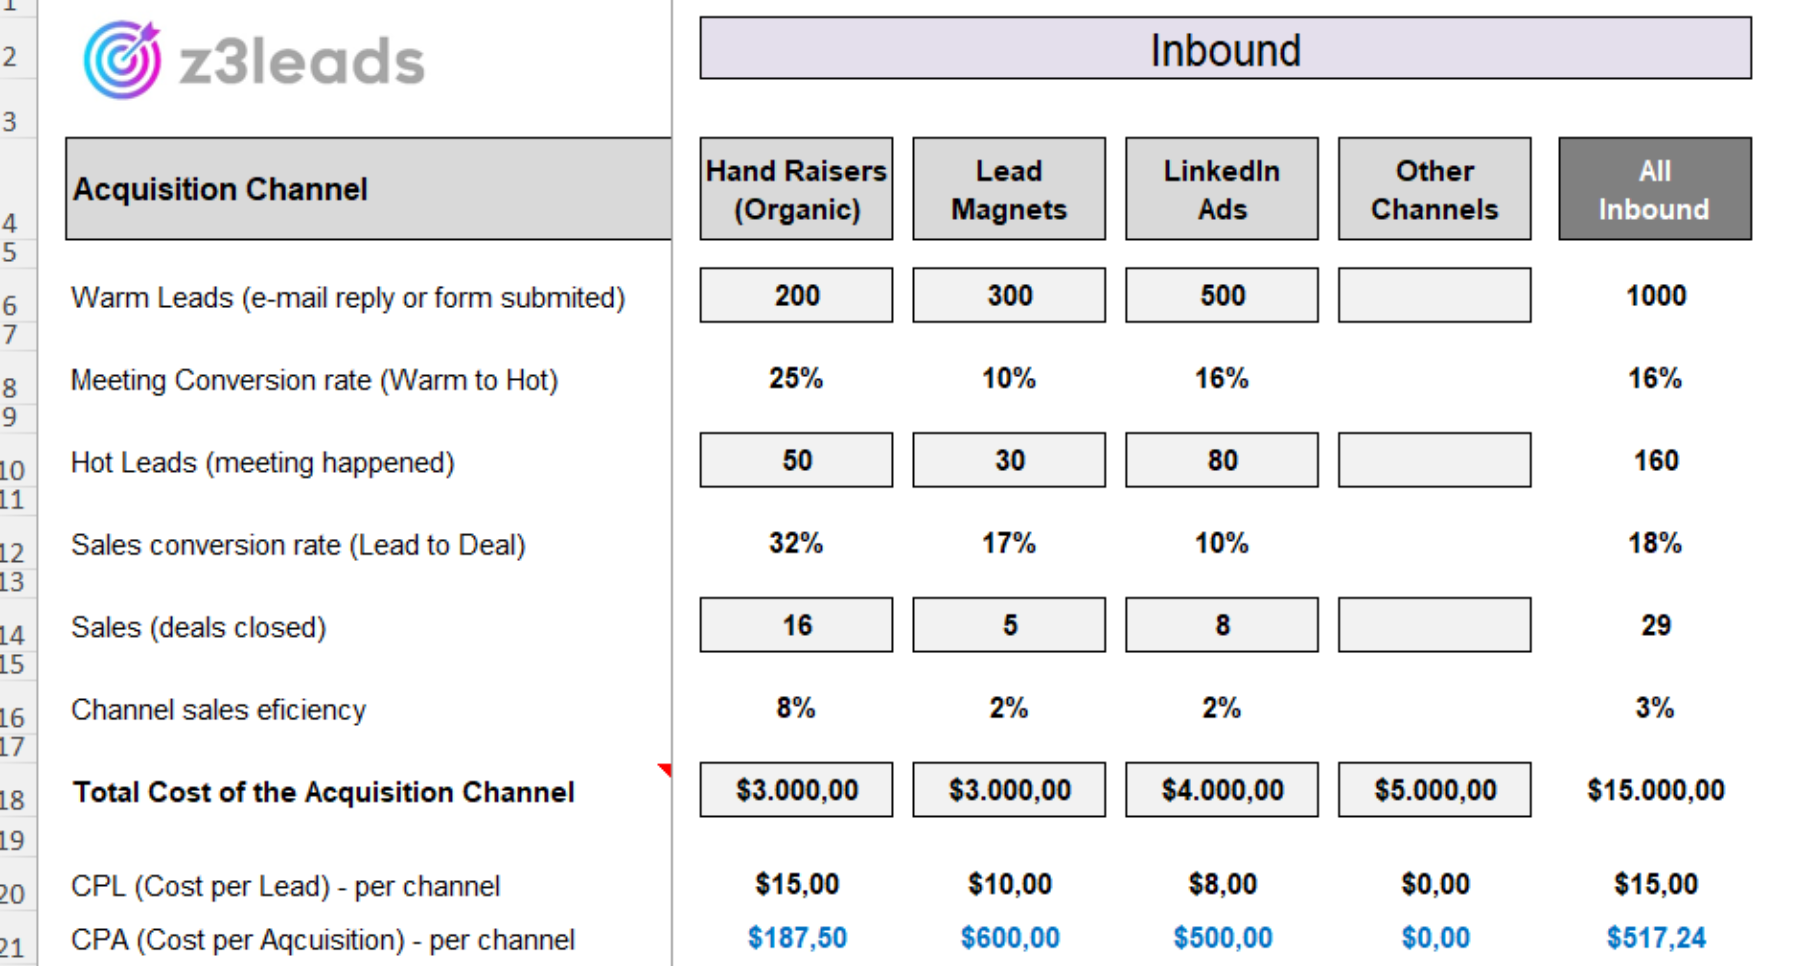
Sales Analytics on a RevOps Level - SDR Program Viability
To assess the overall viability of your sales program, it's essential to evaluate the total cost of your sales team in relation to the number of meetings they can schedule. This evaluation is conducted using the LTV/CAC ratio.
The Life Time Value (LTV) represents the total revenue a customer is expected to generate for the business throughout their entire relationship with the company. On the other hand, the Customer Acquisition Cost (CAC) encompasses all expenses incurred to acquire a new customer across all channels.
An ideal LTV/CAC ratio for most software companies is 3.0x, as it reflects a sustainable and reasonably profitable growth model. A ratio below 1.0x is unsustainable, indicating challenges in monetizing newly acquired customers. This could stem from ineffective strategies or a customer base that lacks spending power or willingness to pay. An LTV/CAC ratio over 5.0x, suggests you are “leaving money on the table”. You will likely need to spend more on new customer acquisitions as it may be missing out on growth opportunities. It may also mean that an early-stage company attempting to disrupt an industry is facing (or soon will face) pushbacks from incumbents and other competitors.
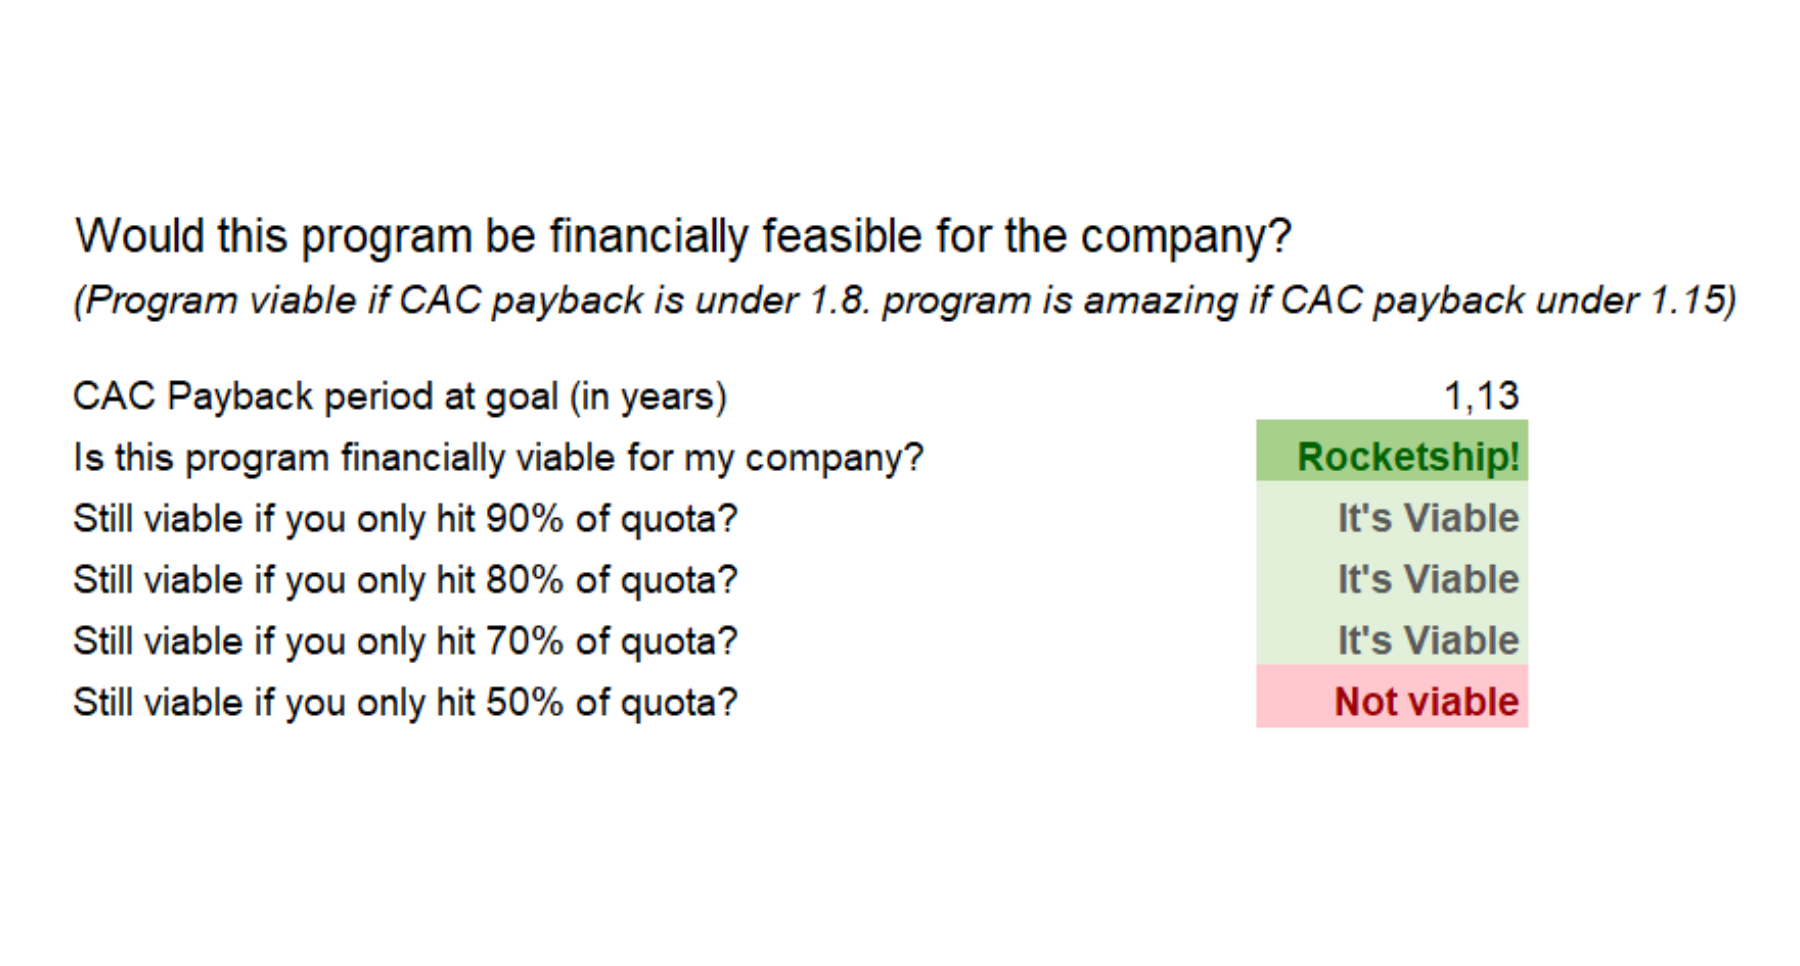
Another valuable metric to consider is the CAC payback period. Calculating this can help determine whether your operations would remain viable if your sales team fails to meet their sales targets. This analysis provides deeper insights into the sustainability and feasibility of your sales program.
Sales Forecasting
If you have successfully achieved all previous benchmarks and have a viable RevOps, congrats! You are on the right path. The next step involves forecasting your future revenue and cash flow based on your investment in sales operations. We already have all the necessary metrics for this, but it is crucial to introduce a new metric obtained from your finance department: the contribution margin.
The contribution margin index is defined as the selling price per unit minus the variable cost per unit. "Contribution" refers to the portion of sales revenue that is not consumed by variable costs, thereby contributing to the coverage of fixed costs. The formula for calculating the Contribution Margin is:
Contribution Margin Index = (Sales - Variable Costs) / Sales
This metric is essential because we aim to forecast our cash flow based on the actual income margin that each sale represents for our business, without considering the variable costs per goods sold. If you have a scalable software business, this won't be an issue since scalability implies that the marginal cost of acquiring one more customer is zero or almost zero (consider how much it costs Netflix to acquire a new customer—essentially nothing or almost nothing). However, if you are not operating as a SaaS, you will need to factor in the "cost of goods sold."
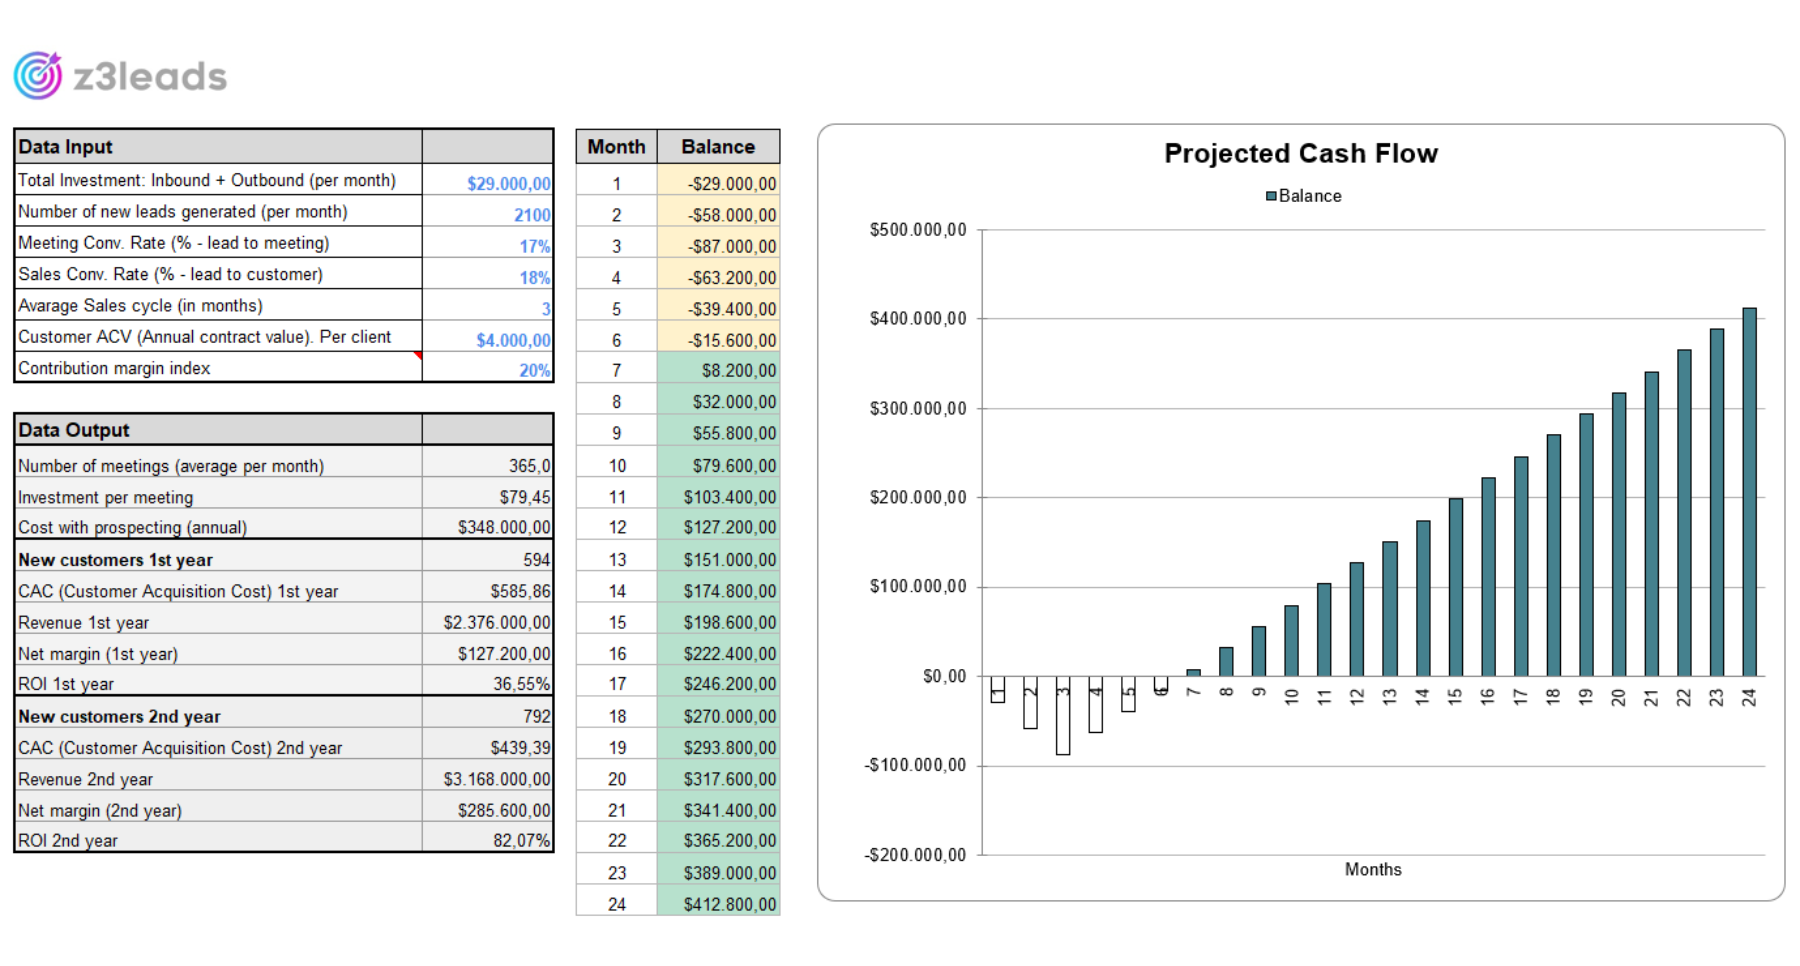
Click here for a free download of this sales analytics and forecasting template spreadsheet.
Explore More Articles